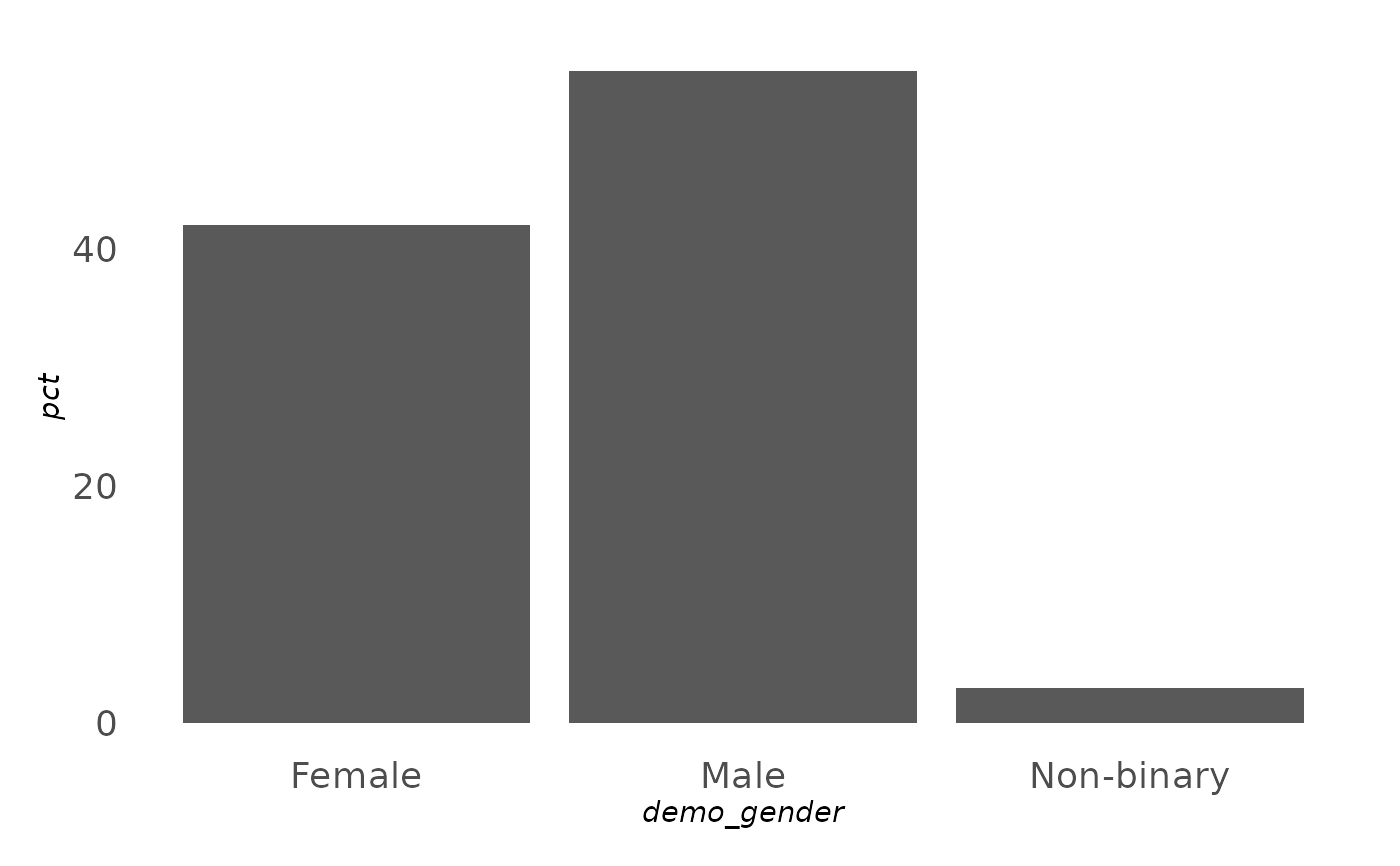
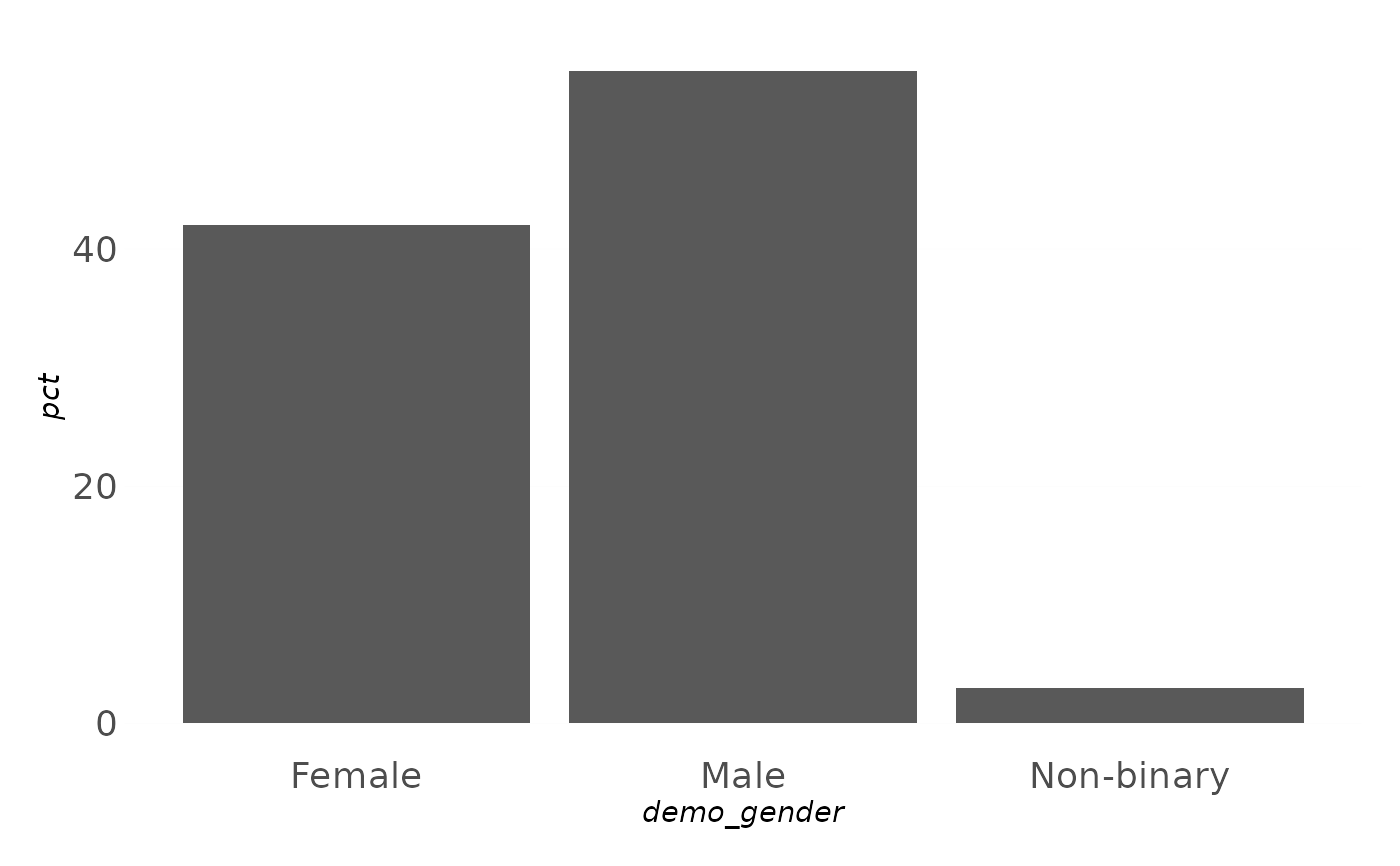
A clean, presentation-oriented theme family for survey reporting. The base
theme strips chart junk – no ticks,
no gridlines, centred bold titles – which suits labelled bar charts that
carry their own data labels. The _x / _y / _xy variants add back faint
major gridlines on the named axes.
Usage
theme_ezrsurvey(base_size = 11, base_family = NULL, transparent = FALSE)

theme_ezrsurvey_x(base_size = 11, base_family = NULL, transparent = FALSE)

theme_ezrsurvey_y(base_size = 11, base_family = NULL, transparent = FALSE)

theme_ezrsurvey_xy(base_size = 11, base_family = NULL, transparent = FALSE)
Arguments
- base_size
Base font size in points. Defaults to
11.- base_family
Base font family.
NULL(default) uses the brand body font when one is set and installed (seeuse_brand()), else"sans".- transparent
If
TRUE, make the plot, panel and legend backgrounds transparent (handy for slides). Defaults toFALSE.
Value
A ggplot2::theme() object to add to a plot with +.
Details
A clean, presentation-first look: no axis ticks, no chart junk, bold centred
titles, and faint gridlines only where you ask for them. The base
theme_ezrsurvey() strips gridlines entirely (best for bar charts that carry
their own data labels); the _x / _y / _xy variants add back faint major
gridlines on the named axes. transparent = TRUE makes the backgrounds
transparent for slides. All the plot_*() helpers apply one of these for you.
See also
Other themes:
pal_rating,
scale_fill_nps(),
scale_fill_rating(),
theme_transparent()