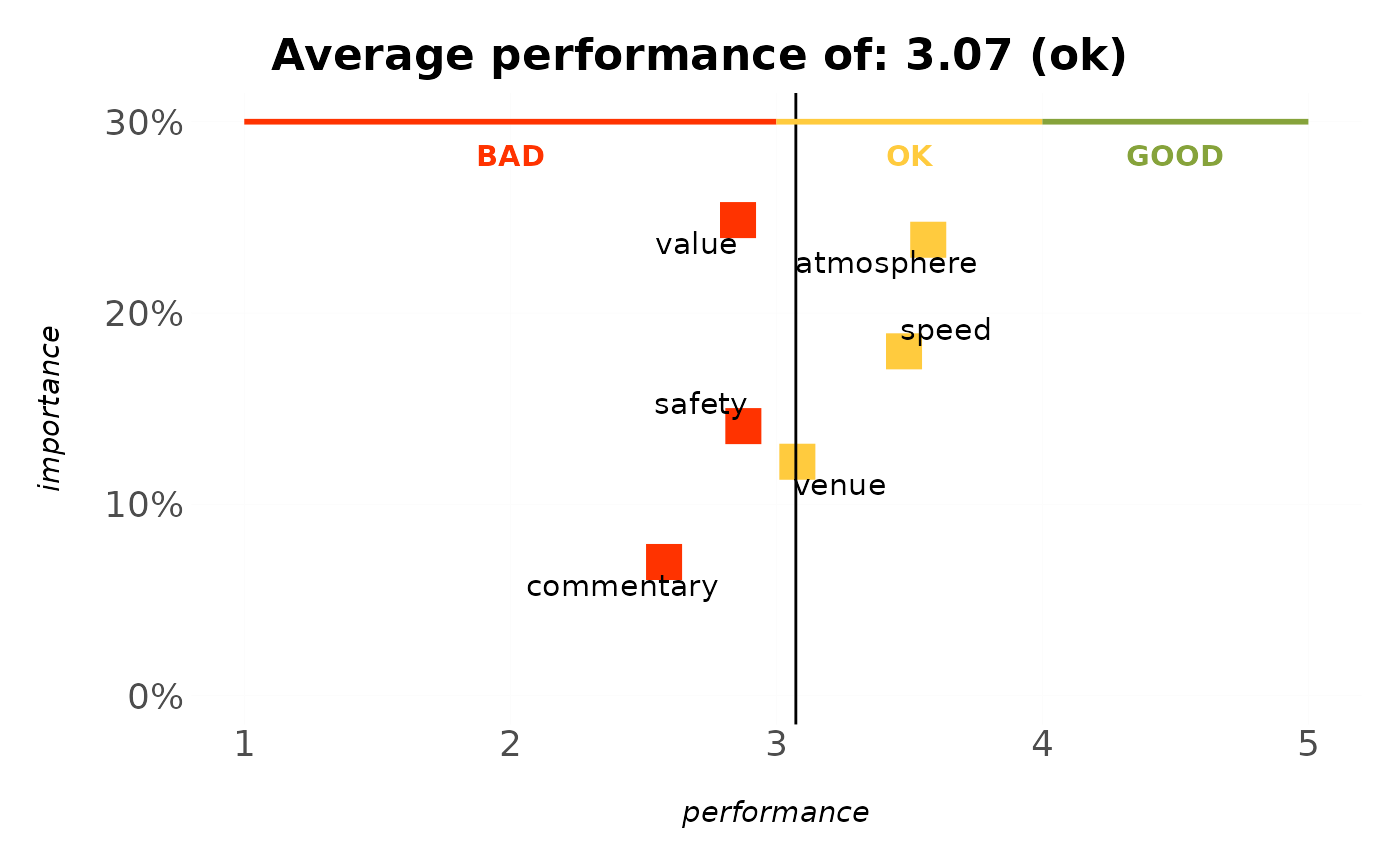
Plots an ipm_model() table as a scatter of feature performance (x) vs.
importance (y), coloured by performance band, with decision bands across the
top: the importance / performance slide of a survey deck, in one call.
Usage
plot_ipm(model, title = NULL, repel = TRUE, bands = bands_rating_3())Arguments
- model
An
ipm_model()output (feature,importance,performance,perf_class).- title
Optional title; defaults to the average performance.
- repel
Use
ggrepelfor non-overlapping labels when available. Defaults toTRUE.- bands
Decision-band spec drawn across the top and used to colour the points. Defaults to
bands_rating_3()(BAD 1-3, OK 3-4, GOOD 4-5).
Details
Each feature is a point: performance on the x-axis (mean 1–5 rating, with a
reference line at the average) and importance on the y-axis (relative weight,
as a percentage). Each point takes the colour of the decision band it falls
in, so a feature averaging 2.4 is red because it sits in the BAD band – the
point and the band behind it can never disagree. Read it by quadrant –
high-importance, low-performance features (upper left) are the priorities to
fix, while high-importance, high-performance features (upper right) are
strengths to protect. Feed it an ipm_model() table; uses ggrepel for
non-overlapping labels when available.