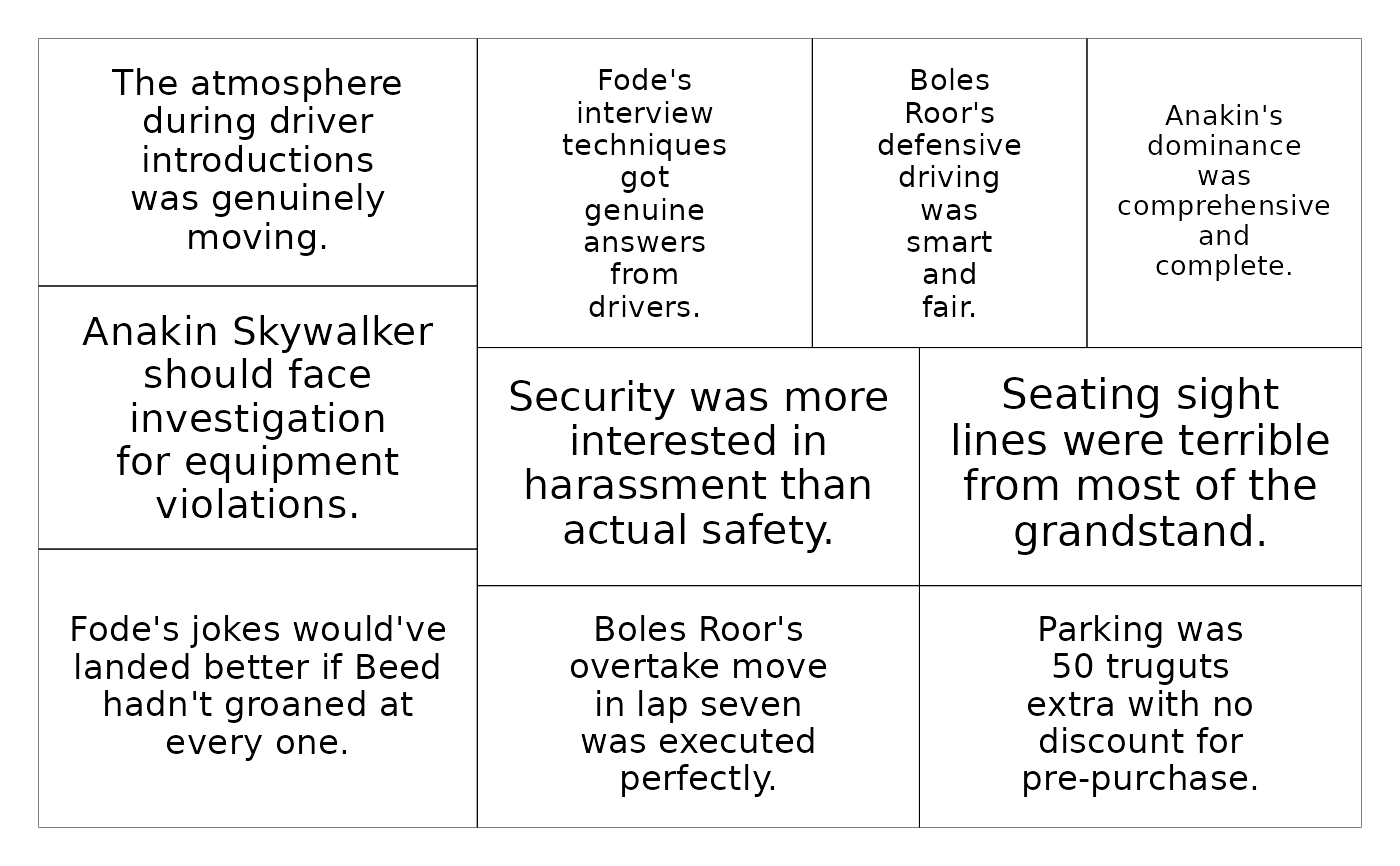
A treemap where each tile is a comment sized by length – the quote slide of
a survey deck. Requires the suggested treemapify package.
Arguments
- data
A data frame of quotes, e.g. from
sample_comments().- label
Text column (unquoted). Defaults to
comment.- area
Tile-size column (unquoted). Defaults to
length.- colour
Tile border colour. Defaults to
"black".
Details
Lays selected verbatims out as a treemap, each tile sized by comment length,
so a slide can show real customer voice at a glance. Pair it with
sample_comments() or sample_comments_diverse(), which produce the
comment/length columns it expects. Requires the suggested treemapify
package.
Examples
sample_comments(podracing_survey, nps_com, show_com, n = 5) %>%
  plot_quotes_tree()