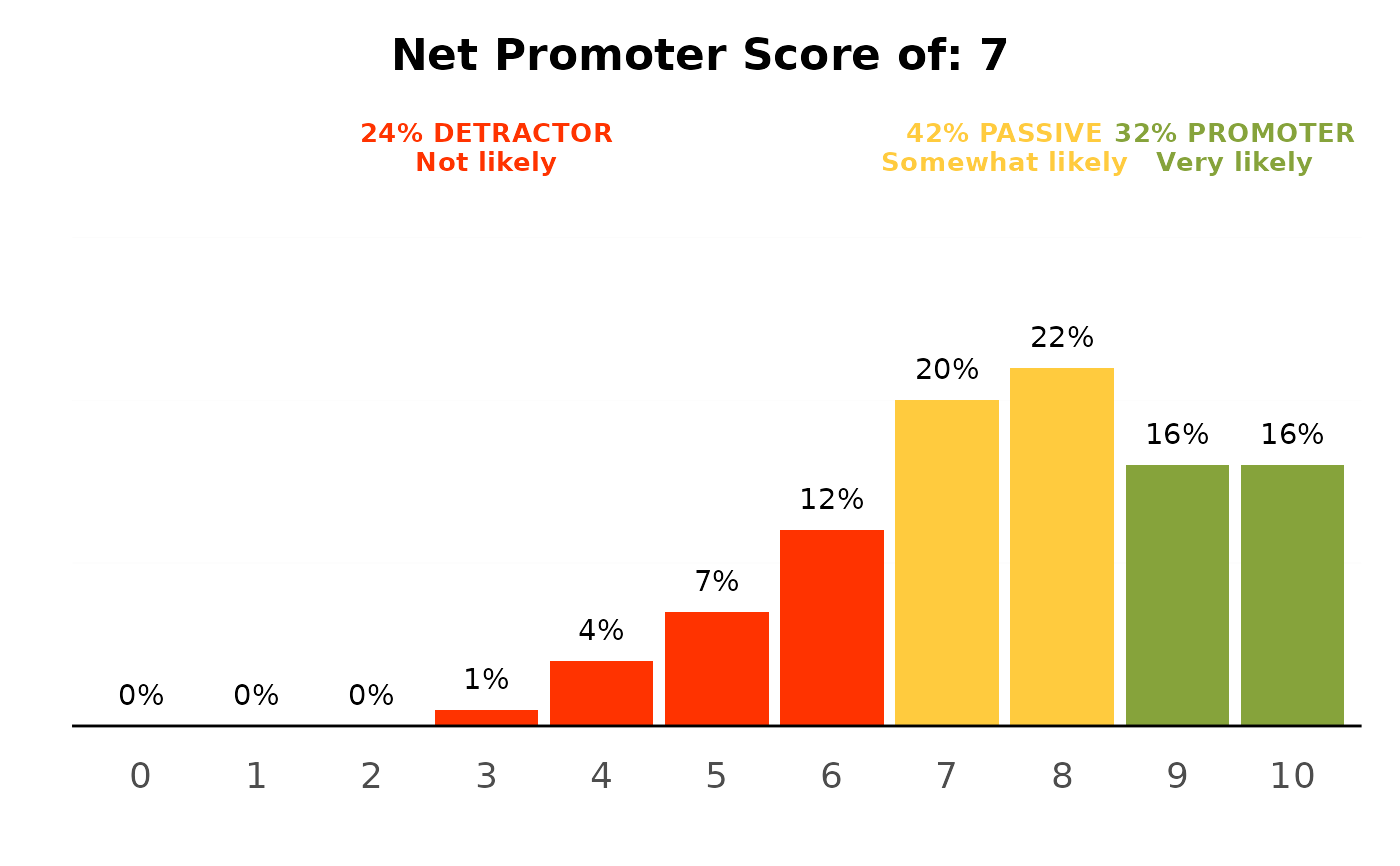
The canonical Net Promoter Score chart: the full 0-10 recommendation distribution as labelled bars coloured by NPS group, with the detractor / passive / promoter shares called out in coloured boxes across the top and the overall NPS in the title: the NPS slide of a survey deck, in one call.
Arguments
- data
A data frame. If omitted, the session default (
use_dataset()) is used.- value
The 0-10 recommendation column (unquoted). Text such as
"8 - likely"is salvaged withensure_numeric().- title
Optional title; defaults to
"Net Promoter Score of: <score>".
Details
Unlike plot_nps_gauge() (which takes a single score), this reads the raw
0–10 column and draws the full distribution: one labelled bar per score,
coloured red/amber/green by NPS group, with the detractor/passive/promoter
shares called out across the top and the overall score in the title. It is the
detailed companion slide to the gauge.