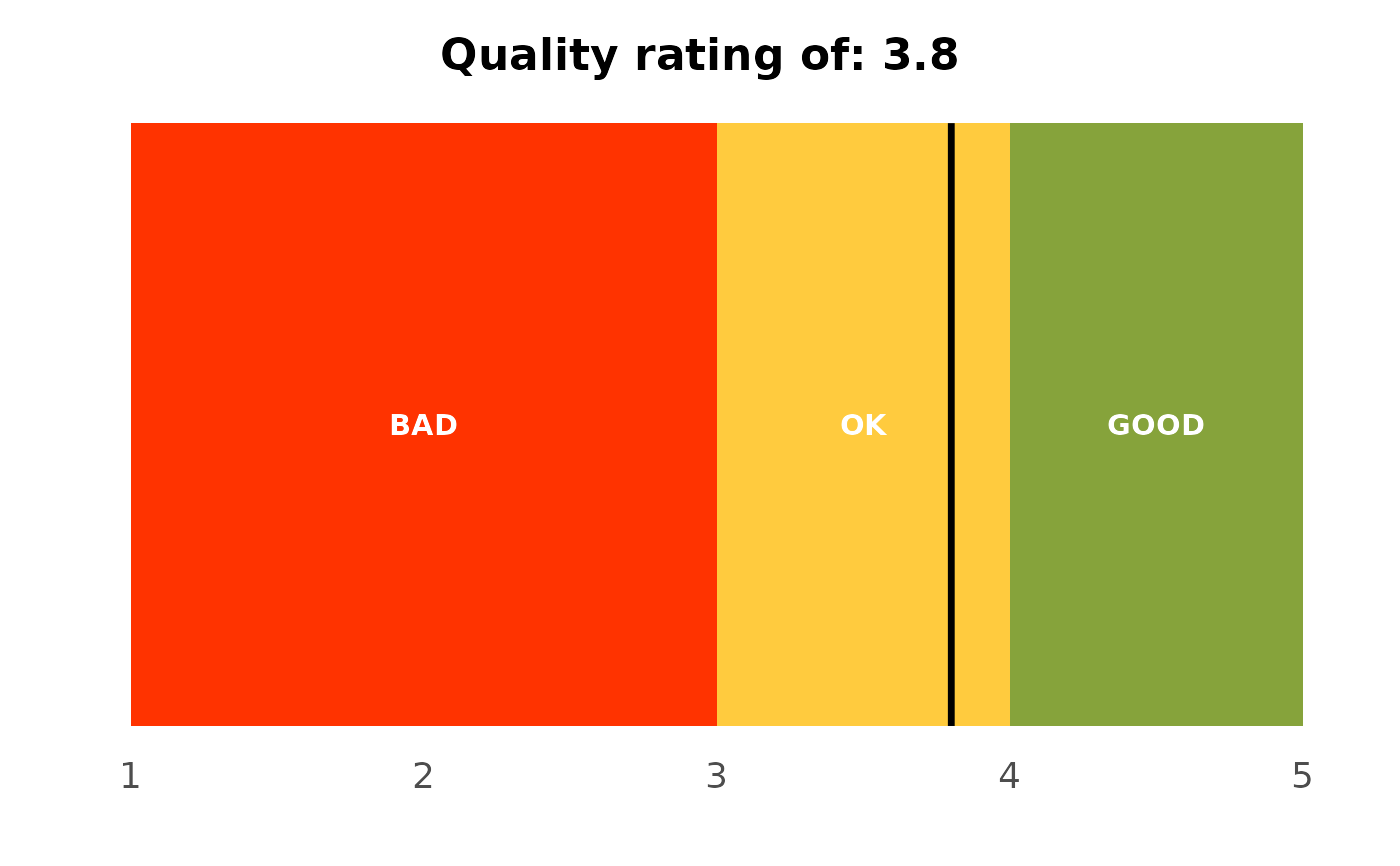
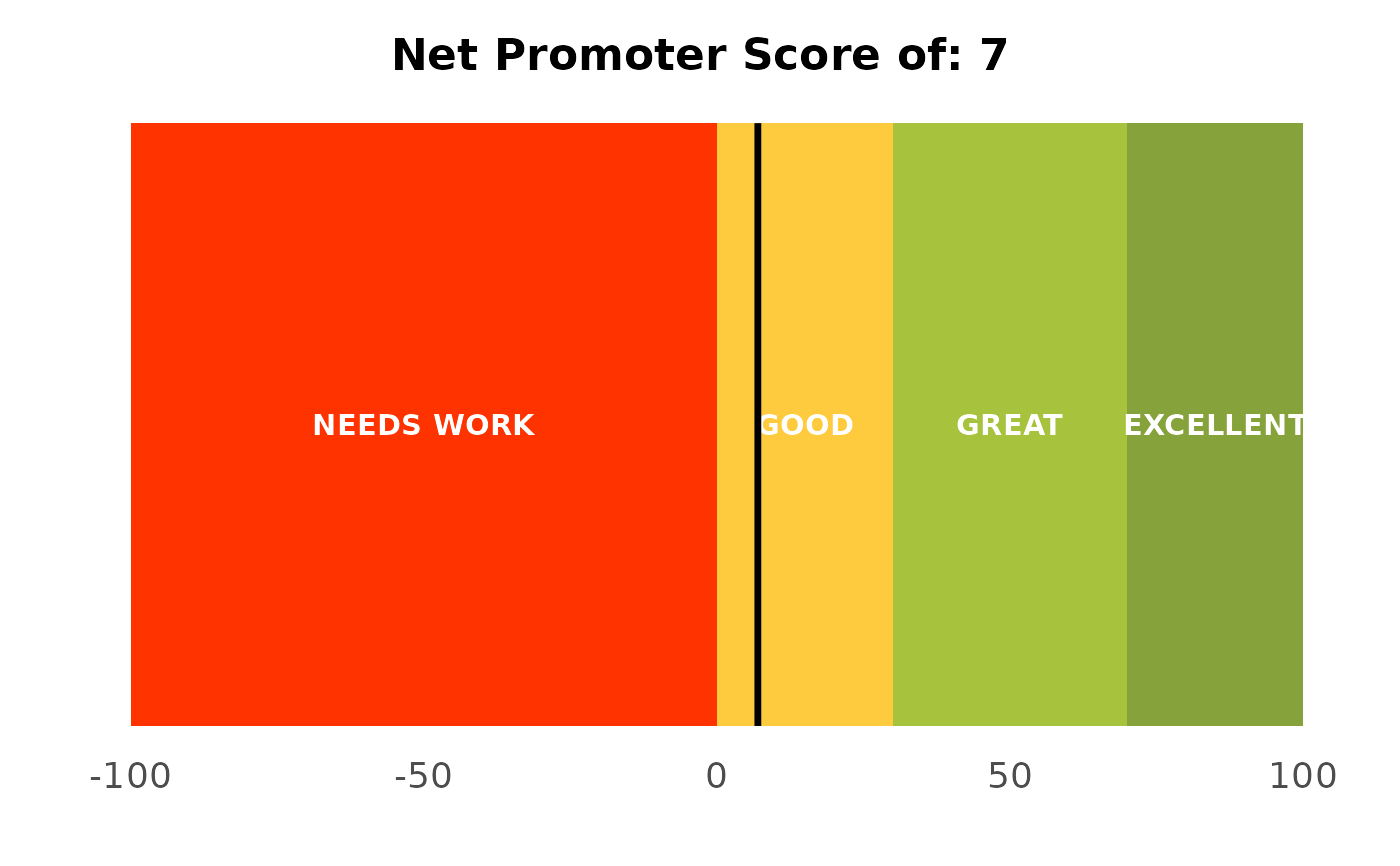
A horizontal gauge that places a single score (NPS or mean rating) onto a banded scale, with a "you are here" marker: the NPS and quality gauges a summary slide carries.
Usage
plot_nps_gauge(
  score,
  scale = c("nps", "rating"),
  title = NULL,
  height = 0.5,
  label_size = NULL
)
Arguments
- score
The score to mark (NPS on -100..100, or a mean rating on 1..5).
- scale
"nps"(default) or"rating", selecting the band layout and limits.- title
Optional title; a sensible default is generated from
score.- height
Bar thickness in plot units. Defaults to
0.5.- label_size
Band-label text size.
NULL(default) matches the theme's base font size (11 pt).
Details
Takes a single number (not a dataset) and places it on a coloured band scale
with a black marker, for the headline "where do we stand" slide. "nps" uses
a -100..100 scale banded from needs-work to excellent; "rating" uses a 1..5
scale with BAD/OK/GOOD bands. Pair it with calc_nps() for the score.
Examples
nps <- calc_nps(podracing_survey, nps_value)$nps
plot_nps_gauge(nps)
 plot_nps_gauge(3.8, scale = "rating")